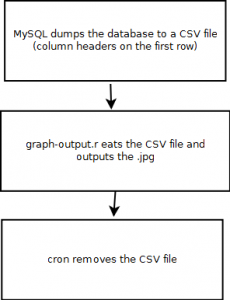
I wanted to see what all the R fuss was about, so I made a script that automatically makes a pie chart. The process goes like this:
The actual R script is only 7 lines long, and that’s only because I went with a 3D graph (it’s 6 lines for 2D graph:)
library(plotrix) mics <- read.csv("/tmp/result.csv",head=TRUE,sep=',') sections <- table(mics$section) lbls <- paste(names(sections), "\n", sections, sep="") jpeg("pie.jpg") pie3D(sections, labels=lbls, explode=0.2, main="Open Mic Activity in the New Jersey Craigslist") garbage <- dev.off() |
This code loads the plotrix library, then loads the CSV of data into the “mics” variable. Afterward, it converts the “section” column into a table, and makes a set of labels (for the upcoming pie chart) based on the table data. Then it opens the JPG file, write a 3D pie chart to it, and closes the file handle.
The hardest part about this was actually learning all of the small MySQL tricks. Since this post is about using R to generate pie charts, I decided to chop the MySQL section into this post: Dumping Data, Saving Passwords, and OUTFILE Syntax with MySQL. If you’re interested in that too, then read it and come back.
After finishing with MySQL, I began to work on the R code listed above. This part was easy. However, I was seeing an annoying problem once the script was cronned; the R script would send output to the commandline. Specifically, “null device 1” was printed once the job finished. Luckily, I wasn’t the only person that ran into this problem:
http://stackoverflow.com/questions/750703/suppressing-null-device-output-with-r-in-batch-mode
Lastly, I wanted to try the 3D pie chart out, since it was seemingly just as simple and the only difference was “3D” in the function name. I needed to install the plotrix package from CRAN, which was as simple as wgetting the file and running “sudo R CMD INSTALL plotrix_3.0-8.tar.gz”. Now I have this:
The placement of the labels is next on the menu. This project gave me a practical reason to experiment with R and generate a pie chart with 7 lines of code.


Hi, I have similar requirement on my unix server where we have csv file and we need a mail to be sent to people with graph in it plotted on basis of stats in that csv file.
format of csv file:
a,15
b,14
c,34