
The Performance Yule Log was born on Christmas when I tweeted:
I animated flamegraphs. It’s the performance Yule Log. #flamegraph #logstash pic.twitter.com/HYgZvMNl1I— Stan Schwertly (@MLACitation) December 25, 2017

The background is a fireplace, and the fire is replaced with an animated series of flamegraph stills.
Flamegraphs visualize stack traces of running processes. In this case, the process was Logstash, an open source data processing pipeline.
Flames and logs, plus Christmas timing, makes the joke. And to me, this joke was worth some time. Overall, I spent a few days working on this GIF, and this blog post covers that general process.
Things I went in with
Going into this project, I was already comfortable with:
- the
perftool on Linux - making basic GIFs on the commandline
- server administration
I wanted to get better at:
- making and understanding flamegraphs
- using
perfon Java processes and getting symbol mappings - making puns on Twitter
- finishing a project all the way to the end
Writing a blog post was part of the goal of finishing this project. To help me remember what I did, I kept a detailed diary in Google Docs along the way. I really like doing this as a memory tool.
Step one: make a GIF of a flamegraph
First I needed a flamegraph, so I provisioned a VM and cloned the flamegraph repository.
Then, I ran perf to get a recording of a process. I picked ls -R / since I knew it’d generate a lot of activity by recursively listing files from the root.
To make the flamegraph, I followed the README from the repository:

Woo! Flamegraphs are actually interactive SVG files — you can search for specific functions, or zoom in on a function and its descendants. I copied the file to my laptop so I could view it.
After the first run, I set up a webserver to make it easier to see the output.
Step 2: Make more SVGs and animate them
Now that I could make a flamegraph, I knew I was on the way to making a GIF of them. I combined the commands from Step 1 into a script so I could easily reproduce and improve the process.
For the first pass, I just ran the script a few more times to get more SVGs. Then I used imagemagick to turn it into a GIF on the command-line:
(This image is the only one set to not loop or autoplay).
Although the image itself is terrifying, the result was really encouraging. I had two questions after:
- Could I animate the flamegraph SVG itself instead?
- Does anything already exist for animating flamegraphs?
I punted on trying to find a workable answer for the first question. It wouldn’t be helping me learn what I set out to learn.
For the second question, I found d3-flame-graph, a D3 Javascript library for generating Flamegraphs. It has support for live-updating graphs too! I decided to come back to this option later, since I didn’t want to lose momentum.
Step 3: Smooth out the GIF
The GIF from earlier suffered from 3 major problems:
- clutter: remove extra text
- opaque: background color should be solid for transparency
- jitter: make it less frantic
To remove the extra text, I yanked out the search code from flamegraph.pl. The title was eliminated by passing --title=' ' on the command-line.
The background gradient logic was removed from flamegraph.pl as well and replaced with white.
Finally, I reduced jitter by slowing down the GIF and making each SVG start at (0, 0). This kept the bottom of the graphs consistent between frames and reduced the bounciness.
All of these changes made it much more stable:
Along the way, I tried out some other command-line flags to make the graphs look more like fire. The “consistent color palette” seemed good, but made the fire too boring and predictable.
Step 4: Tween and a fireplace
At this point I wanted the image to look more natural and fire-like.
Photoshop has a “tween” feature that generates intermediate frames. I’m not sure if the concept is identical, but it seemed perfect for the goal of a more natural looking fire.
After digging through the Imagemagick docs, I discovered the “morph” option:
Perfect! What about a fireplace background? This was the first result:
Step 5: Use a single perf recording to make the GIF
Up until now, I was combining SVGs, where each one was generated from running ls -R /. I knew eventually I’d be recording a long-running Logstash instance, so I started moving on towards that.
Not wanting to solve the Java problem yet, I profiled one of the httpd processes on my VM. I generated load during each recording by running curl in a loop from my laptop.
Aside: Flamegraphs are awesome tour
Flamegraphs are awesome and activate a totally different part of my brain compared to looking through perf report. For example: when I think of profiling using --call-graph=dwarf or not, I have a picture in my head. But comparing a side-by-side Flamegraph makes it so much easier discuss:

DWARF on the left, frame pointers (default) on the right
Another cool view is using addr2line on the trace to get the line-numbers. This feels a little more like a familiar backtrace in the terminal, and the visual representation is really nice:
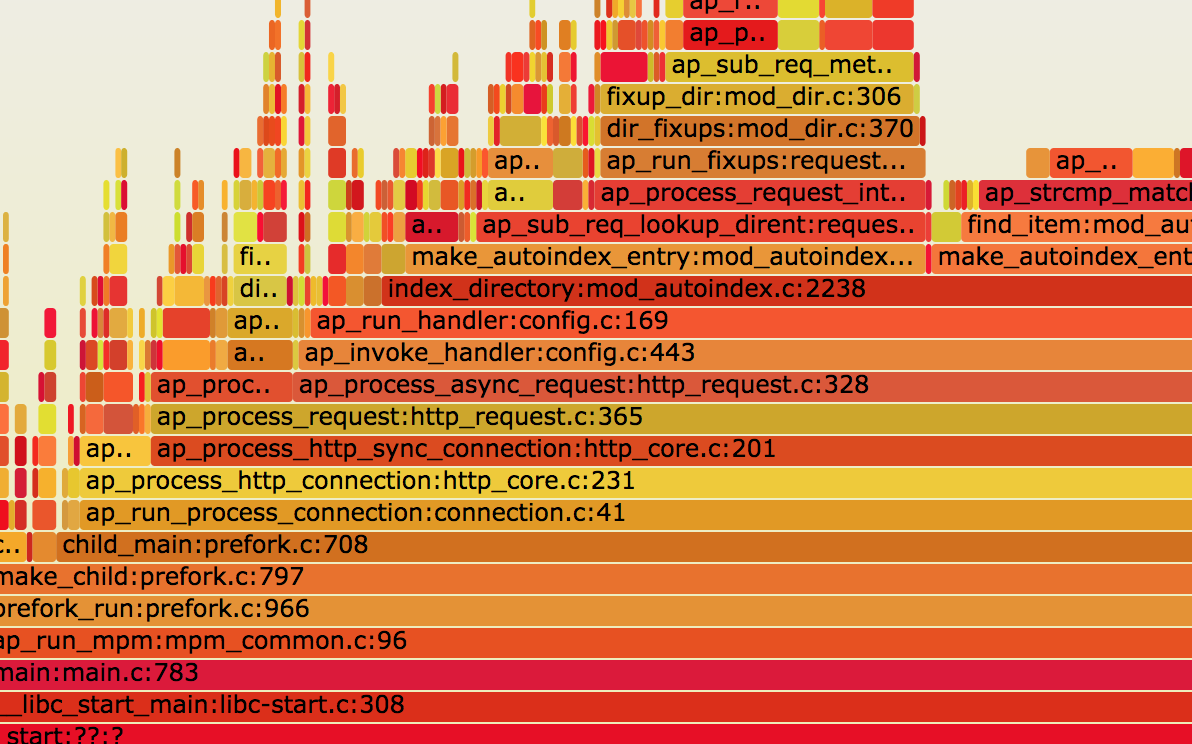
(Getting line numbers makes the graph generation take much longer)
There’s lots of other neat stuff in the Flamegraph repo, like files.pl for visualizing your filesystem:

If you use this on your root partition, use the find command to exclude /proc and /dev, along with any other recursive filesystems
And another thing I learned is that flamegraphs are different than flamecharts!
Flamegraphs don’t use the x-axis to represent time progressing, where flamecharts do. I found this Chromium bug report where the difference is explained in a really helpful way. There’s also some really great discussion about alternative visualizations for this kind of stuff.
There’s a thing in there to generate diffs of flamegraphs too. Try it out and look around!
Back to step 5: GIF from a single recording
Now, I needed to make the same kind of GIF from before, but using a single recording from perf.
I recorded Apache by tracing a single process ID for 10 seconds. Splitting the file turned into a slightly longer dive than I expected.
First, I tried to make myself use the GNU split tool, and then I found the range-perf.pl script from the Flamegraph repository. split didn’t work, but range-perl.pl did fine! I ended up with 10 different files.
The new GIF was much more natural looking, since it wasn’t including the startup phase of a new process in each frame:
Unfortunately, range-perf.pl also made me realize that the last 3 seconds of my perf recordings were empty. In the moment, I worked around this by avoiding those last 3 files.
Later, I went back to dig into this problem, and ended up finding a really cool flag for perf: --switch-output. This lets you automatically write to a new file every N seconds. I switched my script over to using this flag and it worked flawlessly.
Step 6: Try the d3-flame-graph demo
This is alternatively known as the self-sabotage step in the project. I timeboxed this effort as a way of bargaining.
d3-flame-graph uses the well-known D3.js Javascript visualization library to draw flamegraphs in the browser. It also has a live-update demo that you can see here: d3-flame-graph live updating.
For all of my JS worries, I cloned the project and the demo instantly worked on my VM.
Step 7: Make d3-flame-graph work for my data
I opened the network inspector in Chrome to understand the demo more. It takes a JSON blob — and luckily, the documentation links to burn, which converts perf recordings to JSON.
But the demo uses an array as input, and I didn’t see a way to make the tool do the same. This is a point where I became fixated on matching the demo code. In retrospect I could have just changed the demo code.
Marching on, I used jq to help me automatically generate a combined file with the same hierarchy as the demo. This lets me wrap a directory of JSON files into a single file of the right format:
jq 'with_entries(.key |= (. | tostring)) /var/www/html/perf-tests/1513826211-21432/*json
It worked! I couldn’t figure out how to make JS write to a GIF so I used a screen recorder and then converted that:
The demo is more of an animated flamegraph, and my GIF is a bit more like an animated flamechart. I like my GIF’s transitions more for this project though because it looks more fiery.
But there was One Last Thing to try before going back to the GIF, and that was messing with the animation. The D3.js documentation seemed straightforward enough, and maybe I could get a superior fire-look from this library.
“All I have to do is add a transitionEase. Simple!”
I left the rabbit trail after this. (The library is really great though!)
Step 8: Record Logstash and GIF that
Time was starting to run out so I went back to my original plan. The last stage was Logstash: install it, get it running, and record it.
I installed Logstash, and then mashed together a basic configuration. The input was the text of the Christmas carol, and it was set to encode each line to JSON in an infinite loop to burn some CPU.
Excited to collect some data, I ran my scripts against the Logstash PID and saw a familiar message:
Failed to open /tmp/perf-23263.map, continuing without symbols
Here it was! I specifically wanted to learn more about providing symbols to perf for running processes where the symbols are JIT’ed and I was finally here.
Two posts were really helpful here: “Java in Flames” and Brendan Gregg’s “Java Flame Graphs“. I installed java and compiled perf-map-agent, then made logstash start with frame pointers.
Finally, a GIF of animated flamegraphs based on recording a running logstash instance:
I was pretty ready to post the image by now. But there was a couple minor fixes left.
Step 9: Polish and Publish
The remaining issues were with the GIF itself:
- flashing: the fire image disappears at the start of the loop
- repeat: the fire “roars” unnaturally on loop
- size: the image is HUGE, sometimes up to 50MB
Before this project, I felt pretty comfortable making GIFs on the command-line. One of my first projects at the Recurse Center was writing youtube-gif-go. I wrote a lot of blog posts about this. But I never needed to focus on a single GIF for so long, and I was fine with falling back on using GIMP if I got stuck. For this, I tried to force myself to learn more.
The usage guide on ImageMagick’s site is really helpful. I discovered that the first frame of my image was only the background image, so the “flash” was just an empty frame and easy to remove.
For a natural loop, I ended up adding patrol cycles to the GIF. This essentially plays the GIF backwards after the first loop, which removes the rubber-banding problem.
For size, I spent some time reading more about GIFs, and also reduced the input SVGs along the way. I checked Twitter’s documentation for optimal image dimensions and used tools like gifsicle to optimize it.
The final result still pushed the limits but fit within the guidelines of Twitter.
Fun-fact: for this post, the GIFs have been converted to .mp4 and .webm files. This saves lots of space.
The end
The final image is the one in my tweet at the top — you’ll see the loop is more natural and doesn’t flash.
Server configuration and really odd bugs actually took up a big chunk of the time spent on this. I’m saving the highlights for a different post with fewer GIFs. But look out for a GIF of apache running in debug mode, then dying when I resize my terminal. Not the debugging I thought I was signing up for.
That’s it! Thanks for reading along about the making of the Performance Yule Log!